UNILEVER NIGERIA: SET TO CHECK DWINDLING FORTUNES WITH IMPRESSIVE Q1 OUTING

Unilever Nigeria recently unveiled its three-month scorecard to the investing public. The numbers are indeed looking up, gradually reflecting (positively too) the outcome of the back ward integration efforts of the board and management. Added to this is as light improvementin the company's attempt at cost management at amidst thelingering harsh business environmentthat continues to face the nation's real sector. Add this to the weak demand as a result of low purchasing power on the part of the consumers and the picture becomes clearer.
The
company is rewriting its story with the positive first quarter earnings report,
rekindling hope in its investors that the new financial year would be good, after
its poor performance over the last three years in which Unilever Nigeria's
payout and price performance figures had been mostly uninspiring. With this
impressive numbers there is hope for investors if it is sustainedin through the
year.
Specifically,
the numbers revealed a 13 per cent increase in sales revenue to N16.78 billion,
from N14.91 billion in the corresponding first quarter of 2015. This growth in
revenue was driven by the food products segment of its product lines.
Unilever Nigeria had its problems compounded by the absence of a buffer, with little or no retained earnings from its profit, due to its high dividend payout ratio.The cost of servicing its borrowing was adjusted downward by 33.28 percent from the high financial charges of N817.91 million in 2015 to N545.68 million.Also in the same direction, its debt profile decreased marginally with strong operational cash flowwhich has helped to reverse dwindling profits to a stronger profitability level to begin 2016.
All said,
Unilever Nigeria's slight reduction in cost of operation has impacted its profit
level, which grew to N1.04 billion from N590.45 million in the corresponding
year.
Considering this start in Unilever Nigeria's financials, we hope to see higher earnings power in 2016, if the economy improves such that it drives revenue and market price, thereby providing an opportunity for juicier dividend for investors.
The
stock remain grossly overpriced at the current market price. Its book value
stands at N2.39 with price to earnings ratio at 26.57x.
|
UNILEVER NIGERIA PLC
|
|||
|
3 Months 2016
|
|||
|
COY
|
2015
|
2016
|
% Chg.
|
|
(N)
|
(N)
|
||
|
Date Released
|
April 10, 2015
|
April 15, 2016
|
|
|
Price as@Rel.Date
|
41.72
|
29.25
|
|
|
Gross Earnings
|
14,910,995,000
|
16,782,159,000
|
12.55
|
|
Profit After Tax
|
590,448,000
|
1,041,404,000
|
76.38
|
|
Shareholders' Fund
|
8,069,256,000
|
9,044,657,000
|
12.09
|
|
ESTIMATED RATIOS
|
|||
|
Earnings Per Share
|
0.16
|
0.28
|
75.00
|
|
PE Ratio
|
66.83
|
26.57
|
-60.2
|
|
Earnings Yield
|
0.37
|
0.94
|
154.1
|
|
Book Value
|
2.13
|
2.39
|
12.21
|
|
Price/ Book Value
|
19.59
|
12.24
|
-37.5
|
|
ROE %
|
7.32
|
11.51
|
57.24
|
|
Profit Margin
|
3.96
|
6.21
|
56.82
|
|
|
Dec
|
Dec
|
|
SOURCES: COMPANY DATA & INVESTDATA RESEARCH
Valuation/Recommendations
The company
is starting on a positive note. This may enable many investors heave a sign of
relief, with hopethat the momentum would be sustained in the subsequent results.
The first quarter book value of N2.38 and price to book of 12.24x, signifies a
grossly overvalued stock at the current market price, particularly on the
strength of its Price-Earnings-Ratio of 26.57x, which is the highest inits sector.
Unilever Nigeria's share price is fairly and technically placed at N10, and future earnings will determine any review.
The company has been paying off all its earnings as dividend, just to appease the majority shareholders and parent company- Unilever Overseas Holdings, which last year increased its holding to 75 percent. The commencement of its backward integration, effective cost management and expansion to target more markets may further influence its performance. We advise investors in the stock to HOLD, while traders should sell and reposition later.
History
Unilever Nigeria Plc, was incorporated as Lever Brothers (West Africa) Limited on April 11, 1923 by Lord Leverhulme. After a series of mergers/acquisitions, the company diversified into manufacturing and marketing of foods, non-soapy detergents and personal care products.
These mergers/acquisitions brought in Lipton Nigeria Limited in 1985 and Cheesebrough Ponds Industries Limited in 1988. The company changed its name to Unilever Nigeria Plc in 2001.
Today, Unilever Nigeria Plc is a public liability company, quoted on the floor of the Nigerian Stock Exchange since 1973 with Nigerians having 25 per cent of equity holdings.
It manufactures
and markets consumer products primarily in the home, personal care and foods
categories and sells products like Omo washing powder, Key Soap, Royco
bouillon, Lipton Tea, Blue Band margarine, Pears baby care goods, Vaseline
petroleum jelly, Lux soap, and Close-Up toothpaste.
The stock has enjoyed constant positive fundamentals which in turn attracts good patronage from the investing public, due to its consistently high dividend payout.
In
recent years, its sales revenue has been dwindling, a reality that was evident
in the last two years when dividend payment declined by 92 per cent and 50
percent respectively in 2014 and 2015.This weak performance was further deepen
by the 5 Kobo dividend declared by the board.
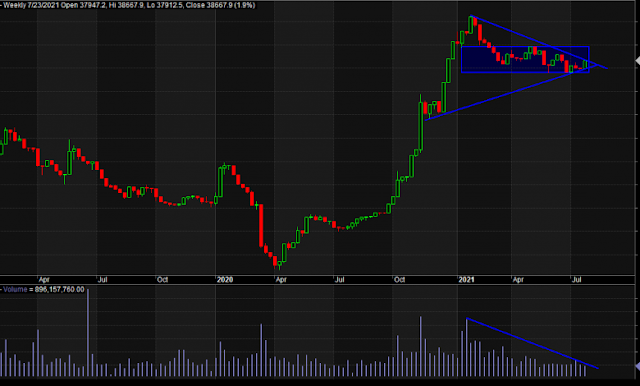
The price movement of the equity through last financial year was mixed as it closed higher than the opening price. With Unilever international successfully raising its stake, the new holding structure will be as shown in the table below.
|
Unilever
Nigeria PLC
|
|
|
Share
Holding Structure
|
|
|
Unilever
Oversees Holding BV
|
75.00%
|
|
Nigerians
|
25.00%
|
|
Other
Statistics
|
|
|
Shares
Outstanding (MN)
|
3,783,296,250
|
|
Opening
Price (2015)
|
N35.80
|
|
Closing
Price (2015)
|
N41.72
|
|
Closing
Price as at April 15
|
N29.25
|
|
Date
Listed
|
September,
1973
|
|
Year
End
|
31st
December
|
Management
It is
true that a company’s earnings performance reflect the management’s commitment,
competence and ability to strategically reposition its products or services to
drive profitability. The recent
scorecard of Unilever shows that
the company's management team as woken up to deliver value and return it to its
pre-eminent position in the days of old when Unilever Nigeria was known for impressive
performance, supporting its operation and share price.
Performance Analysis
Performance Analysis
Looking
at the numbers posted over a five-year period, it is obvious that the business
environment was challenging for Unilever as infrastructure problems like power
and high cost of borrowing impacted the cost of production negatively. There
was also the effect of increasing competition from equally formidable
companies, as well as cottage industries with close substitutes for its
products on offer at cheaper prices.
But then, a cursory look at the company's financials for the period of 2011 to 2015, reveals that the problem did not start just now. Within the period, Unilever Nigeria marginally built its sales revenue. The full year turnover stood at N59.22 billion from the N54.72 billion in 2011 after hitting high of N60 billion within the five-year period.
Meanwhile, profitability level nosedive to N1.19 billion from N5.52 billion in 2011 representing 78.44 percent decline, after recording high of N5.59 billion in 2012, before declining to N1.19 billion in 2015.
Shareholders' fund on the other hand currently stands at N8.00 billion after touching low of N7.45 billion in 2014 from N9.63 billion in 2011 after it had hit N10.04 billion in 2012. Please note: This is a breakdown of the numbers posted within the period under consideration.
The company's unfailing dividend payment policy with a high payout ratio made the stock investors' choice before now. The current dividend of 5 kobo, represents a 50 per cent decline from 10 kobo paid in 2014, after it had rewarded shareholders with N1.25 in 2013 and N1.40 in 2012 and 2011 respectively.
The paying of all its earnings as dividends to investors has affected its shareholders fund, working capital and retained earnings before now.
The last payout was 15.62 per cent of earnings after the company earnings power had nose-dived by 50 per cent.
The high payout as a result of capital flight has started affecting the company, but with the recent years low payout due to weak earnings its retained earnings has inched up.
|
UNILEVER FIVE YEARS
FINANCIAL PERFORMANCE
|
|
||||
|
|
2011
|
2012
|
2013
|
2014
|
2015
|
|
Date Released
|
April 18,2012
|
April 4, 2013
|
March 28, 2014
|
March 26, 2015
|
March 24, 2016
|
|
Price @ Released Date
|
N28.70
|
N53.50
|
N45.15
|
N37.48
|
N30.92
|
|
Gross Earnings
|
54,724,749,000
|
55,547,797,896
|
60,004,119,201
|
55,754,309,000
|
59,221,748,000
|
|
Profit After Tax
|
5,515,213,000
|
5,597,613,329
|
4,806,907,383
|
2,412,343,000
|
1,192,366,000
|
|
Shareholders' Fund
|
9,634,650,000
|
10,043,523,594
|
9,639,695,298
|
7,478,808,000
|
8,003,253,000
|
|
Dividend
|
N1.40
|
N1.40
|
N1.25
|
N0.10
|
N0.05
|
SOURCES: COMPANY DATA & INVESTDATA
RESEARCH
Estimated
Performance Ratios
The
company's financial ratio for the period under review shows that the amount
earned by investors and management were low at 32 kobo in 2015, compared with
the high of N1.48 in 2012, while 2014, 2013 and 2011 recorded earnings per
share of 64 kobo, N1.27 and N1.46 respectively. This is a reflection of the
company's unstable earning power. The 2015 price to earnings ratio is high at
the estimate of 98.11x from the low of 19.69x in 2011. The last full year EPS
is a yield of just 1.02 per cent of the market price as of the release date.
This simply signifies an overvalued stock by the market as against the posted
numbers.
This was further indicated by the Book Value that ranges between the low of N1.98 and high of N2.65 for the period under review. This ratio and the market price of the stocksignals a serious caution for short and medium term investors. The profit margin of the company is low and poor by all standard.
This was further indicated by the Book Value that ranges between the low of N1.98 and high of N2.65 for the period under review. This ratio and the market price of the stocksignals a serious caution for short and medium term investors. The profit margin of the company is low and poor by all standard.
|
UNILEVER- ESTIMATED RATIOS
|
|
||||
|
|
2011
|
2012
|
2013
|
2014
|
2015
|
|
Earnings Per Share
|
1.46
|
1.48
|
1.27
|
0.64
|
0.32
|
|
PE Ratio
|
19.69
|
36.16
|
35.54
|
58.78
|
98.11
|
|
Earnings Yield
|
5.08
|
2.77
|
2.81
|
1.70
|
1.02
|
|
Book Value
|
2.55
|
2.65
|
2.55
|
1.98
|
2.12
|
|
ROE
|
0.57
|
0.56
|
0.50
|
0.32
|
0.15
|
|
Profit Margin
|
10.08
|
10.08
|
8.01
|
4.33
|
2.01
|
|
Year End
|
Dec
|
Dec
|
Dec
|
Dec
|
Dec
|
SOURCES: COMPANY DATA & INVESTDATA
RESEARCH


Comments
Post a Comment