NEM INSURANCE: IMPRESSIVE EARNINGS, CONSISTENT DIVIDEND, PRICE STABILITY

Foremost Nigerian Insurance Company, NEM, recently released
its first quarter earnings report for the period ended March 31 to the
investing community, and the numbers were significantly up as the company's top
and bottom lines pointed to the north direction. It is obvious that the insurer
is strongly consolidating its performance to create more value for
stakeholders, comparing the current scorecard to the 2015 numbers of the same
period. Gross Premium was higher, when
compare to 2015 first quarter, just as profit for the period increased by a
significant 64 percent from N1.39 billion in 2015 to N2.29 billion. Shareholders'
fund growth was sharp at 37 percent, closing at N8.49 billion from the previous
first quarter's N6.21 billion.
Earnings per share estimates improved from the said Q1
figures to N0.43 as against N0.26 in the comparative period of 2015, surpassing
the company's 2015 full year EPS, following which investors' waiting period
crashed to 0.44x from 0.67x. The said Earnings yielded 56.36 percent of the
current market price, well above the 37.28 percent yield estimated in 2015.
Please note that the full year earnings is estimated at
trailing EPS of N0.35 and above, because this company is good in posting
impressive quarterly earnings but at the end of the year the earnings are lower
than the quarterly figures. As revealed by the company's full year earnings,
quarterly results are not fully representative of end of the year numbers.
Also, it is becoming a norm in its industry that management account trend
differs from the full year earnings of the companies. As the company's assets
base is increasing, the figure posted also reflect the commitment of NEM
management to turn its assets into profit that would drive share price above
the resistance level.
|
NEM INSURANCE
|
|||
|
FIRST QUARTER
|
|||
|
COY
|
2015
|
2016
|
% Chg
|
|
(N)
|
(N)
|
||
|
Date Released
|
October 21, 2015
|
April 22, 2016
|
|
|
Price @ Released Date
|
0.71
|
0.76
|
|
|
Gross Premium
|
3,480,730,000
|
4,013,041,000
|
64
|
|
Profit After Tax
|
1,139,520,000
|
2,291,605,000
|
36
|
|
Shareholders' Fund
|
6,207,334,000
|
8,498,942,000
|
26.53
|
|
Dividend
|
|||
|
ESTIMATED RATIOS
|
|||
|
Earnings Per Share
|
0.26
|
0.43
|
|
|
PE Ratio
|
0.67
|
0.44
|
|
|
Earnings Yield
|
37.28
|
56.36
|
|
|
Book Value
|
1.18
|
1.61
|
|
|
Price to Book
|
1.66
|
2.09
|
|
|
ROE
|
22.53
|
26.00
|
|
|
Profit Margin
|
40.15
|
57.10
|
|
|
Year End
|
Dec
|
Dec
|
|
SOURCES: COMPANY DATA & INVESTDATA
RESEARCH
Valuation/Recommendations
On the strength of the previous full year book value of 1.17
and the first quarter EPS of 43 kobo,
NEM Insurance is set to rally above any resistant while the 3-months
Book Value (BV) was estimated at N1.61 which is almost same as the trailing BV
of N1.65. Price to Book Value (PBV) currently stands at 2.09 as at the end of
first quarter of 2016.
Judging by the projected EPS of 0.35 for the full year 2016,
the share price of NEM Insurance is technically placed at N1.65. The constant
dividend payment and improving profit margin ratio reveal management's
proactiveness and cost efficiency.
Traders and investors should look the way of the stock as performance
and profitability ratios are becoming stronger and a good start off for the new
financial year. Our opinion is that investors and traders should take position.
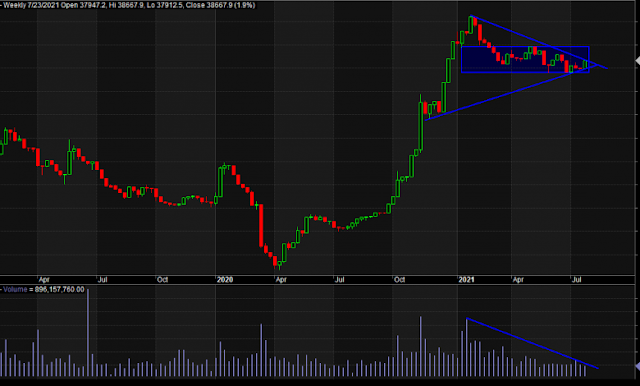
Technical View

NEM has been trending up in a bullish
channel since Jan 15, 2016 and had a pullback in late May within the channel to
touch the lower support line, but later rebound in early June to breakout from
the channel to form a double top reversal chart pattern which indicates that
the stock may likely pullback again as profit takers cash out. The company
share price has been relatively stability despite the oscillating mood of the
general market.
History
NEM INSURANCE PLC started insurance business in
Nigeria in 1948 through the agency of Edward Turner & Co. It became a
Nigerian branch of NEM General Insurance Association Limited of London in 1965.
Incorporated in 1970 as a Nigerian company in compliance with the Companies
Decree of 1968, the company became quoted on the Nigerian Stock Exchange in
1989 following the privatisation exercise of the Federal Government of
Nigeria. The company has expanded its operations into the West African Sub
region, with the successful registration and commencement of business by its
subsidiary, NEM INSURANCE (GHANA) LIMITED in May, 2009. N.E.M. Insurance Plc
provides general and non-life insurance.
|
NEM Insurance
|
|
|
Share Holding Structure
|
|
|
Jeidoc Limited
|
6.98%
|
|
Bukson Investment Limited
|
6.38%
|
|
Other Statistics
|
|
|
Shares Outstanding (MN)
|
5,280,502,913
|
|
Opening Price (2016)
|
N0.66
|
|
Closing Price as @ April 22, 2016
|
N0.68
|
|
Date Listed
|
5th September, 1990
|
|
Year End
|
31st December
|
SOURCES: COMPANY DATA & INVESTDATA
RESEARCH
Earnings Performance
The
leadership of NEM Insurance has recently complied with its post-listing
requirement to enhance its corporate governance. If this is sustained, going
forward, the investing public's perception of the company will be enhanced.
This company's gross premium performance for the five years was mixed as it
grew significantly from N8.38 billion in 2011 to N10.90 billion in 2015
representing 30 percent rise for the period. On the other hand, Profit for the
period shows that the company recorded a growth of 181.77 percent from N253.29
million in 2011 to N713.70 million after hitting a 'high' of N1.53 billion in
2014, the retained earning has helped NEM to meet the dividend expectation. Its
profitability ratio has been unstable to reflect the prevailing situation in
the economy. The year 2011 seem to be the start of rebuilding it bottom line in oscillating trend
after it had recorded appreciable growth of almost 50 percent in 2012 and a
drop of 11 percent in 2013 before recording a geometric growth of 286 percent
in 2014, before slipping in 2015 to N713.70 million, representing a 53.21
decline from 2014 figure. The projection for the full year performance of 2016
full year score card is high, as the
company had turned a new leaf which it would likely sustain, added to the
strong start for 2016 financial year.
Total
equity/shareholders’ funds was slightly stable and looking up within the
observed years, rising by 48 percent to N6.20 billion from N4.19 billion in 2011, after it had
recorded a high of N6.87 billion in 2014. Although this is encouraging, the
management needs to make frantic efforts to consolidate the figure, so as to
improve cogent ratios necessary in the valuation of the firm. Its consistent
dividend payment for the last five years has made its share price relatively
above 70 kobo, despite the downturn in the markets and economic situation.
|
NEM INSURANCE FOUR YEARS FINANCIAL PERFORMANCE
|
|
||||
|
2011
|
2012
|
2013
|
2014
|
2015
|
|
|
Date Released
|
Tuesday, April 16, 2013
|
Monday, April 28, 2014
|
Monday, Oct. 27, 2014
|
March, 20, 2015
|
April 11 2016
|
|
Price @ Released Date
|
0.50
|
0.50
|
0.73
|
0.84
|
0.74
|
|
Gross Premium
|
8,381,196,000
|
9,652,556,000
|
8,933,345,000
|
9,266,749,000
|
10,895,711,000
|
|
Profit After Tax
|
253,294,000
|
455,312,000
|
395,060,000
|
1,525,301,000
|
713,702, 000
|
|
Shareholders' Fund
|
4,185,328,000
|
4,316,427,000
|
4,695,693,000
|
6,865,777,00
|
6,199,362,000
|
|
Dividend
|
0.05
|
0.06
|
0.06
|
0.06
|
0.06
|
SOURCES: COMPANY DATA & INVESTDATA
RESEARCH
Profitability Ratios
The company's earnings power, currently stands at N0.14k,
which is about 16 percent of its market value. The said earnings could account
for 5.77x of the price at released date and have been estimated to yield 17.35
percent of the price. Please note the fluctuations recorded year on year in
PE/Ratio and Earnings Yield. Estimated Ratios shows that the return made on
equity ranges between 22 percent and 6 percent with the return at 12 percent in
(2015). While the reported Profit for the year was estimated at 6.55 percent of
the Gross Premium (2015) and have ranges between the high of 16.46 percent and
other years profit margin are not encouraging, because the numbers are low.
|
NEM INSURANCE- ESTIMATED RATIOS
|
|
||||
|
2011
|
2012
|
2013
|
2014
|
2015
|
|
|
Earnings Per Share
|
0.05
|
0.09
|
0.07
|
0.29
|
0.14
|
|
PE Ratio
|
10.42
|
5.80
|
10.16
|
2.91
|
5.77
|
|
Earnings Yield
|
9.59
|
17.25
|
9.84
|
34.39
|
17.33
|
|
Book Value
|
0.79
|
0.82
|
0.89
|
1.30
|
1.17
|
|
ROE
|
0.06
|
0.11
|
0.08
|
0.22
|
0.12
|
|
Profit Margin
|
3.02
|
4.72
|
4.42
|
16.46
|
6.55
|
|
Year End
|
Dec
|
Dec
|
Dec
|
Dec
|
Dec
|
SOURCES: COMPANY DATA & INVESTDATA
RESEARCH


Comments
Post a Comment