TRADER WATCH

Year to date market performance and First Quarter Review.
In the last one year after the pronouncement of the
incumbent president as the winner of the presidential election of 2015, the
nation stock market had continued to nose-dive to formed a bearish channel to
reflect the falling macro-economic indices of the economy as the nation
external reserve continue to look southward, naira lost value as exchange rate
hit all high of N420 per dollar before adjusting to N380 in
the back market due to limited forex, low purchasing power of Nigerians as
inflation and interest rate are looking northward reducing the propensity to
save that will drive investment. The
market had remained under the upper line of the bearish channel which is the
blue line standing as a strong resistance level all through the period of one
year despite the seeming recovery recorded in the last two months of the first
quarter which was attributed to the early earnings surprises that ushered the
earnings season of 2016.
The Composite
NSE All Share Index for the first quarter of the year lost 3,336.03 points to
close the period at 25,306.22 from an opening figure of 28,642.25 points, after
it had recovered to high of 26,020.40 representing 11.64 percent decline. The
Market capitalization also drop by 11.68 percent from N9.85 trillion it opened
the year to N8.70 trillion representing a value loss of N1.15 trillion.The
year-to-date returns of the NSE's basic indicator is currently 10.95 per cent
negative, just as market capitalisation for the same period has lost N1.08 trillion.
Within the first quarter trading period the market had 33 bull sessions and 30
bear trading sessions to record a mixed performance of one month down market
and two months up market.
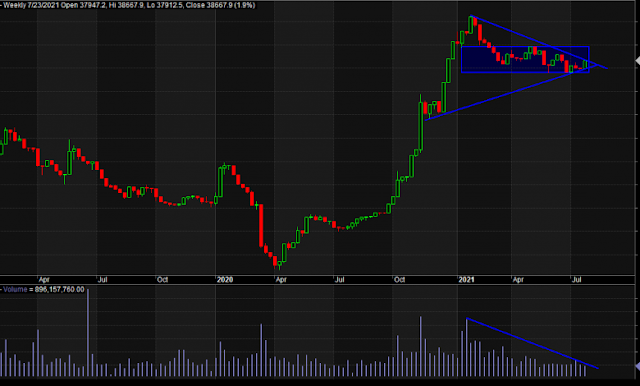
NSEASI Weekly Time Frame of YTD

NSEASI closed above the lower band by 44.7%. During the past 10 bars, there have been 5
white candles and 5 black candles.
During the past 50 bars, there have been 20 white candles and 30 black
candles for a net of 10 black candles. Currently MACD is
bullish since
it is trading above its signal line. It crossed above its signal line 4
period(s) ago. Since the MACD crossed
its moving average, NSEASI's price has decreased 1.21%, and has ranged from
a high of 26,250.34 to a low of 24,181.51.RSI is currently reading 42.59. Other
indicators MACD and CCI are signaling buy while Stochastic Oscillator is giving
sell signal. As the market continue to trade below the blue line the bear
remain in charge, suggesting that traders and investors should target stocks
that are outperforming the market now due intrinsic value and other
fundamentals in favour the stocks. The chart above also revealed that the
market is trading below the short and long moving average like 20, 50 and 100
DMA. This is also a signal of weak
market with less external stimulus to trigger upmarket in the short term.
NSEASI Quarterly Time Frame

The chart above has shown that the market have been trending
down since the third quarter of 2014, the pre-election year as the major fund
provider of the market, the foreign and institutional investors that had
continue to pull their funds out the market due fear of the unknown before the
election and after the election as a result of unclear economic policy to give
direction, unstable monetary policy and fear of not getting their stack in
Nigeria as exchange rate has remained volatile.
NSE Sectorial
Indexes Trading Range Remains above 50 DMA Despite the weak Market
The charts below are thesectorial
indices tradingrange of the NSE, representing sectors and industries for
effective reading and analysing of the market's performance on sector by sector
basis. As you can see, three of the ten sectoral indices are trading below the
50-day moving average, while othersare trading above the moving averages. The sectors below 50DMA is NSE Insurance,NSE
Banking and NSE Premium. NSE 30, NSE 50,
NSE Industrial and NSE Consumer are above the 50 DMA at the end of last Friday
trading as revealed on the chart. The
more sectors trading below the 50-day moving average is an indication of down
trend and weak market. As most sectors
have entered into its oversold region it’s expected that reversal is imminent
with huge upside potential when it bounces back.
NSE BANKING INDEX

Banking index has gone back below its 50 days moving average
after the earning season sentiment had trigger the positive momentum due to
earnings surprises that emanated from the big five banks. The
chart has shown that the banking index have been trading majorly below its
50 days MA over years due to its overregulation and influence of policies.
NSE 30

NSE 30 is still trading above its 50 days MA, suggesting
that the blue chips stocks that made up the index are strong but there is
already a reversal in trend as the index is almost crossing down the 50 DMA as
at the end of trading last Friday. It also signal that traders are exiting
position
NSE 50

The 50 days moving average is forming a support level for
NSE 50 as the index has signal immenint reversal as it touches the red line.
Meaning that stocks that constitute the index are resisting further decline in
price.
NSE CONSUMER GOODS INDEX

The Consumer Goods index is still trading above its 50 days
moving average as more of its earnings were just released recently and market
players are interpreting the numbers especially to know whether to jump into
the industry stocks.
NSE INDUSTRIAL INDEX

The industrial index is strongly trading above its 50 days
Moving Average which by the same period in 2015 where above the 50DMA. It
suggests that if you are there in the stocks that made up the sector you need
to act fast and re-enter later depending on your investment goal.
NSE INSURANCE INDEX

Insurance index is trading far below its 50 days moving
average as few earnings reports from companies that made up the sector were mixed
as many are yet to release their scorecards, but forming a double bottom is a
signal for reversal if only the expected numbers are impressive and investors
are rewarded in relative to their par value prices.
NSE OIL/GAS

NSE Oil and Gas is slightly trading above it 50 days Moving
Average as the prices of the major companies in that industry are relative
stable due to small number of share issue.
NSE LOTUSISLM

NSE LOTUS is trading above its 50 days Moving Average with
reversal above the red line, this is indication that stocks in the index are
still galloping.
NSE PENSION

NSE Pension index is trading slightly below the 50-DMA
NSE PREMIUM INDEX

Premium Index is strongly trading above its 50 days moving
average, as two out-off the three stocks that constitute index had rewarded
investors handsomely.


Comments
Post a Comment