7-UP BOTTLING COMPANY: PRICE DECLINE ON RED ACCOUNT POSITION

The board of
7-Up, the only listed soft drinks bottling company on the Nigeria Stock Exchange
(NSE), recently released its full-year earnings report for the period ended
March 31, 2017 to the investing community in line with its post-listing
requirements. To enable investors plan and forecast their investment, the
company has in the past five years has become regular in releasing its numbers
within the stipulated time frame.
The 2017
full-year numbers revealed a mixed performance as the top line moved northward
while the bottom turned red from profit in the comparable year. The
high financing and cost of sales have served as a major factor of earnings
volatility for Fast Moving Consumer Goods (FMCG) in recent times amidst higher
debt balances on a number of balance sheets due to the high cost of production
which has robbed on 7-Up. This was also despite the growth in sales revenue to
show that its market share or segment is still expanding but high of operation
has eaten up profit, pushing it to a huge loss position of N10.78bn in just one
financial year, despite the decline in profit 2016.
In the midst of the current tight monetary environment and
possibility of further currency movements, we expect finance charges to stay elevated
in the short-term, even as the high cost environment may lead to further
increase in short term borrowings which is already high in the case of 7-Up.
This operating cash flow in red is not good for the company and its
stakeholders for now until there is a turnaround again to profit. Even then, the
company’s Price to Earnings ratio of 26.79x in 2016 had already shown that the
company is struggling to grow earnings to support its share price.
Any attempt by the company to raise the price of its product at this
point could be suicidal, as such a move would further discourage consumption in
the face of the stiff competition among major carbonate beverage and water
packaging companies, especially the cottage industries. Amidst the currency weakness, and
consequent increase in imported input prices, there has been an uptrend in cost
of production and sales.
However, the higher demand for its products, coupled
with pass through from higher transportation prices and sustained supply shocks
from the cottage industry continue to threaten future sales, made worse by the
company's heightened debt position. Added to these key ratios like return on
assets and cost to sales of 7-Up are 10.78% and 88.79% in the red respectively.
The company’s
retained earnings declined to N13.79bn from N24.78bn without major investments
in capacity building for this period, a pointer to the fact that all is not
well. For the processed numbers look at
the table below.
|
7UP BOTTLING COMPANY PLC.
|
|||
|
AUDITED FULL YEAR MARCH 2017
|
|||
|
2016
|
2017
|
% Chg
|
|
|
(N)
|
(N)
|
||
|
Date Released
|
June 29, 2016
|
June 30, 2017
|
|
|
Price as @ Released Date
|
140.00
|
91.00
|
-35.00
|
|
Turnover
|
85,634,579,000
|
108,277,000,000
|
26.45
|
|
Profit After Tax
|
3,347,463,000
|
-10,776,712,000
|
-421.8
|
|
Shareholders' Fund
|
24,779,594,000
|
13,225,471,000
|
-46.61
|
|
Dividend
|
1.60
|
nil
|
|
|
ESTIMATED RATIOS
|
|||
|
Earnings Per Share
|
5.29
|
-16.82
|
-418.0
|
|
PE Ratio
|
26.79
|
-5.41
|
-120.2
|
|
Earnings Yield
|
3.73
|
-18.49
|
-595.7
|
|
Book Value
|
38.68
|
20.65
|
-46.61
|
|
Price to Book Value
|
3.62
|
4.41
|
21.82
|
|
ROE(%)
|
13.53
|
-81.48
|
-702.2
|
|
Profit Margin
|
3.91
|
-9.95
|
-354.5
|
Source: Company Financials& Investdata
Research
The company’s declining
quarterly profitability became noticeable the during 2017 financial year, just
as reacted appropriately, following which its share price moved southwards to
reflect the weak performance. Even many traders and institutional investors who
once saw the stock as one to manage risk in their portfolio started exiting
earlier to cut loss.
The disappointing numbers as
a result of which approval of dividend would not be one of the items on the
agenda at the next annual general meeting triggered a 5% loss of share price as
at released date, revealed investors ’negative sentiments for the equity,
considering the loss position.
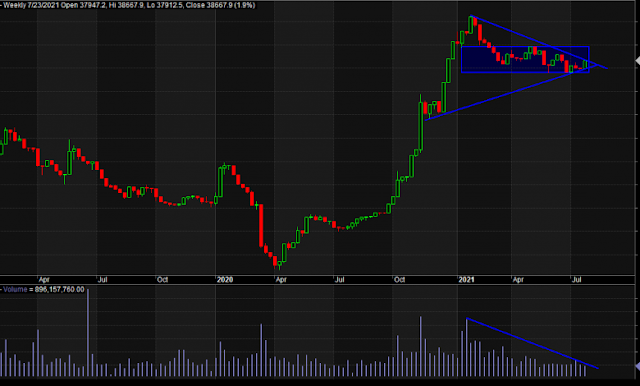
Technical View
7-Up’s price rally to the peak in 2016 was driven by impressive
numbers of previous years before the company performance started dwindling following
the release of its numbers for the 2016 financial year. The price action has
formed a falling channel chart pattern that supports trend continuation,despite
various attempts to reveres that fail.
The share could bottom out, on the basis of its shareholding
structure, around N68 per share.
However, any new positioning should wait to see the Q1 and
strong support level before jumping into it for the medium to long term.

The lower
lows is making the stock attractive as the economic recovery is likely to
impact positively on it performance going forward, meaning that investors
should keep 7-Up on their watch list to know
exactly when to position.
|
7 UP Bottling Co PLC
|
|
|
Share Holding
Structure
|
|
|
Affelika S.A
|
73.22%
|
|
Nigerian and others
|
26.78 %
|
|
Other Statistics
|
|
|
Shares Outstanding (MN)
|
640,590,363
|
|
Opening Price (2017)
|
N155.00
|
|
Closing Price as @March
31”17
|
N83.00
|
|
Closing Price as @June 30, “17
|
N91.00
|
|
Market Capitalisation
|
N58,293,723,033
|
|
Date Listed
|
1986
|
|
Year End
|
31st March
|
Five-Year Performance Indices
The market continues to revalue the company’s share price on
the strength of numbers posted since 2016 before this last financial year ended
31st March 2017, compared to the impressive performance recorded between 2013
and 2015 which supported the price rally witnessed during the period. The bottling
company over the past five years seems to have recorded a constant growth in
sales revenue, while profitability declined until it slipped into the red zone
at N10.78bn in 2017.
Turnover gradually rose from the N64.09bn in 2013 to N108.28bn
in 2017; just as bottom line had a geometric growth in the first three years of
period under consideration, before turning negative in 2017. From N2.87bn in
2013, it peaked at N7.13bn in 2015 before dropping to N3.35bn in 2016, from
where it turned red in 2017.Profit recorded through the five-year period was mixed
as the price moved up and then down to the level it was last week end. Total Equity for the same period recorded same
trend, falling to N13.23bn from its high of N24.78bn in 2016 and N12.58bn posted
in 2013 to reflect investment injection into its capacity building.
One of the strong supporting factors of the equity before now
was its constant reward in terms of dividend payment to shareholders, no matter
how small, in relation to its share price and strong earnings power that had
just disappeared to keep the stock on a downtrend. Looking at the table,
investors have cumulatively taken N9.05 per share as dividend in five years.
Please note that the company’s share capital has remained
constant for this period and is also relatively small to support the numbers
and share price so far. This company, even with its increasing capacity, is yet
to meet the growing demand for its products, since it rebranded and repackaged
its products. Demand for its products
have been on the increase as reflected on its top line,but earnings have
remained in the red due to the high cost of operation, increasing debt and competition
with the cottage industry .
|
SEVEN BOTTLING COMPANY PLC FIVE YEARS FINANCIAL POSITIONS
|
||||||
|
|
2013
|
2014
|
2015
|
2016
|
2017
|
|
|
Date Released
|
August 1,2013
|
June 30, 2014
|
June 29, 2015
|
June 29, 2016
|
June 30, 2017
|
|
|
Price @ Released
|
72.00
|
93.00
|
179.10
|
140.00
|
91.00
|
|
|
Turnover
|
64,088,879,000
|
77,888,548,000
|
82,450,505,000
|
85,634,679,000
|
108,277,000,000
|
|
|
Profit After Tax
|
2,865,504,000
|
6,434,601,000
|
7,125,788,000
|
3,347,463,000
|
-10,776,712,000
|
|
|
Total Equity
|
12,577,980,000
|
17,328,695,000
|
23,933,633,000
|
24, 779,594,000
|
13,225,471,000
|
|
|
Dividend
|
2.20
|
2.50
|
2.75
|
1.60
|
Nil
|
|
|
Bonus
|
Nil
|
Nil
|
Nil
|
NIL
|
Nil
|
|
Source: Company
Financial & Investdata Research
Ratio Analysis
The company’s earnings power and growth reflected on its
earnings per share that moved from N4.47 in 2013 to N10.04 in 2014 and to
N11.12 in 2015, after which it dropped in 2016 to N5.23, before this latest loss
per share of N16.82 each. Investors’ negative response to the latest unimpressive
results and weak earnings can be traced to its increasing their waiting
investment period from 16.10x in 2013 to negative 5.41x of the period of entry.
Please note that the 2017 full year loss per share yielded negative 18.49
percent of the price at released date. Returns on Equity employed through the
period were on the average 24.23%before the negative return of 81.48%, while
the margin of the profit to the turnover figures stand low between 4.47% and
8.28% to reflect the huge cost of operation. This should expectedly require immediate
action from management, because it led to the loss position.
Unfortunately, the book value of the company is far below its
market value, an indication of the premium placed on the stock by the investing
public, suggesting that management should also grow its assets to build margin
of safety.
|
SEVEN BOTTLING COMPANY PLC- ESTIAMATED RATIOS
|
|||||
|
|
2013
|
2014
|
2015
|
2016
|
2017
|
|
Earnings Per Share
|
4.47
|
10.04
|
11.12
|
5.23
|
-16.82
|
|
PE Ratio
|
16.10
|
9.26
|
16.10
|
26.79
|
-5.41
|
|
Earnings Yield
|
6.21
|
10.80
|
6.21
|
3.73
|
-18.49
|
|
Book Value
|
19.63
|
27.05
|
37.36
|
38.68
|
20.65
|
|
Price to Book
|
3.67
|
3.44
|
4.79
|
3.62
|
4.41
|
|
ROE (%)
|
22.78
|
37.13
|
29.77
|
13.51
|
-81.48
|
|
Profit Margin (%)
|
4.47
|
8.26
|
8.64
|
3.91
|
-9.95
|
|
Year End
|
March
|
March
|
March
|
March
|
March
|
Source: Company Financial &
Investdata Research


Comments
Post a Comment