TECHNICAL POSITION OF SELECTED EQUITIES ON THE NSE

The equity
market continued its weekly rally as investors’ sentiment remained positive due
to the expected very short bull transition in a bear market, despite the
current side trending mood of the market as revealed by the Composite Index
NSEASI movement that is attempting to breakout the resistance level of 30,350
to 30,580 points. Below are the
technical position of the selected few equities at the end of last week
trading.
FO

On September 18, Forte Oil closed above the
lower band by 28.8 per cent. Bollinger Bands are 19.86 per cent narrower than normal. The current width of
the bands does not suggest anything conclusive about the future volatility or
movement of prices. During the past 10 bars, there
have been four white and two black candles for a net of two white candles.
During the past 50 bars, there have been 23 white candles and 14 black candles
for a net of nine white candles. Currently the MACD is bearish
since it is trading below its signal line. The MACD crossed below its signal
line 9 period(s) ago. Since the MACD
crossed its moving average, FO's price has decreased 2.63 per cent, and
has ranged from a high of N234.99 to a low of N216.41. The current value of the
RSI and Stochastic Oscillator are 53.12 and 74.77 respectively.
Analyst Opinion:
Traders in FO should take profit while investors
should keep their gaze on the company's shareholding structure for the
possibility of offer for sales, knowing that it was the shareholding structure
that has supported the price and not fundamentals.
DANGOTE CEMENT
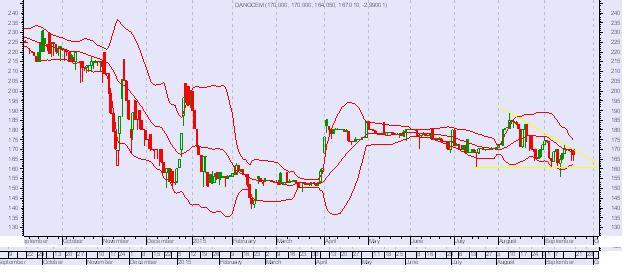
On September 18 also, DANGCEM closed above the
lower band by 37.0 per cent. Bollinger Bands are 51.32 per cent narrower than normal. The narrow width of the
bands suggests low volatility as compared to DANGCEM's normal range. Therefore, the probability of volatility
increasing with a sharp price move has increased for the near-term. The bands
have been in this narrow range for 1 period(s). The probability of a
significant price move increases the longer the bands remain in this narrow
range. During the past 10 bars, there have been five
white candles and three black candles for a net of two white candles. During the past 50 bars, there have been 22
white candles and 19 black candles for a net of three white candles.MACD
crossed above its signal line three period(s) ago. Since the MACD crossed its
moving average, DANGCEM's price has decreased 1.76 per cent, and has ranged
from a high of N170.00 to a low of N164.00. The current value of the RSI is
44.64.
Analyst Opinion:
Dangote Cement has formed a descending triangle
pattern that suggest a continuation or reversal of the event as price closed
lower that it opened on the last trading of the week. Traders should wait to
confirm before taking short position, while investors with long term investment
perspective should accumulate at this low price.
NASCON

NASCON closed below the upper band by 14.1 per
cent. Bollinger Bands are 14.28
per cent narrower than normal. The current width of the bands does not suggest
anything conclusive about the future volatility or movement of prices. During the past 10 bars, there have been six white candles
and four black candles for a net of two white candles. During the past 50 bars, there have been 16
white candles and 22 black candles for a net of 6 black candles. Currently the
MACD is bullish since it is trading above its signal line. The MACD
crossed above its signal line 13 period(s) ago.
Since the MACD crossed its moving average, NASCON's price has increased 7.05 per cent and has ranged from a high of N6.69 to a low of N5.80. The
current value of the RSI and Stochastic Oscillator are 57.60 and 87.50
respectively.
Analyst Opinion:
This stock is already forming a double top with
the yellow line, any positioning by Traders or Investors now should wait to
confirm breakout or pullback.
OKOMU OIL PALM

OKOMUOIL closed below the upper band by 10.8 per
cent. Bollinger Bands are 106.68
per cent wider than normal. The large width of the bands suggest high
volatility as compared to OKOMUOIL's normal range. Therefore, the probability
of volatility decreasing and prices entering a trading range has increased for
the near-term. During the past 10 bars, there have
been seven white candles and 0 black candles for a net of seven white candles.
During the past 50 bars, there have been 11 white candles and 12 black candles
for a net of 1 black candle. Currently the MACD is bullish since it is trading above its signal line. The MACD crossed above its
signal line 13 period(s) ago. Since the
MACD crossed its moving average, OKOMUOIL's price has increased 21.59 per cent and has ranged from a high of N29.60 to a low of N23.75.
The current value of the RSI is 77.72.
Analyst Opinion:
Traders that positioned in this stock at the
beginning of the month should take profit, while investors with long term goal
should wait for pullback before positioning.
ACCESS BANK
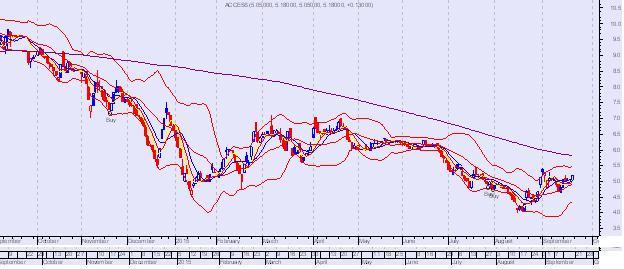
ACCESS closed below the upper band by 26.0 per
cent. Bollinger Bands are 18.72
per cent narrower than normal. The current width of the bands does not suggest
anything conclusive about the future volatility or movement of prices.During the past 10 bars, there have been five white candles
and four black candles for a net of one white candle. During the past 50 bars,
there have been 20 white candles and 27 black candles for a net of seven black
candles. Currently the MACD is bullish since it is trading above its
signal line. The MACD crossed above its signal line 20 period(s) ago. Since the MACD crossed its moving average,
ACCESS' price has increased
10.45 per cent and has ranged from a high of
N5.40 to a low of N4.26. The current value of the RSI and Stochastic Oscillator
are 57.90 and 77.69 respectively.
Analyst Opinion:
Investors should use low price of the stock now
to increase stake in the bank. The very short term traders should keep their
gaze on this stock
BERGER PAINTS

BERGER closed below the upper band by 0.4 per
cent. Bollinger Bands are 31.99
per cent wider than normal. The current width of the bands (alone) does not
suggest anything conclusive about the future volatility or movement of prices. During the past 10 bars, there have been two white candles
and one black candle for a net of one white candle. During the past 50 bars, there have been
eight white candles and 13 black candles for a net of 5 black candles.
Currently the MACD is bullish
since it is trading above its signal line. The
MACD crossed above its signal line 11 period(s) ago. Since the MACD crossed its moving average,
BERGER's price has increased
9.72% and has ranged from a high of N9.93 to a
low of N9.05. The current value of the RSI and Stochastic Oscillator are 66.63
and 95.83 respectively.
Analyst Opinion:
Profit booking underway, as the stock is
struggling to break out.
CUSTODIAN & ALLIED

CUSTODYINS closed below the upper band by 22.2
per cent. Bollinger Bands are 55.87
per cent narrower than normal. The narrow width of the bands suggests low
volatility as compared to CUSTODYINS's normal range. Therefore, the probability
of volatility increasing with a sharp price move has increased for the
near-term. During the past 10 bars, there have been
two white candles and one black candle for a net of one white candle. During the past 50 bars, there have been 11
white candles and nine black candles for a net of two white candles. Currently
the MACD is bullish since it is trading above its signal line.The MACD crossed
above its signal line 0 period(s) ago.
Since the MACD crossed its moving average, CUSTODYINS's price has been
unchanged, and has ranged from a high of N4.06 to a low of N4.06. The current
value of the RSI is 53.70.
Analyst Opinion:
Breakout is imminent and any taking position in
the stock should be now.
ASHAKA CEMENT
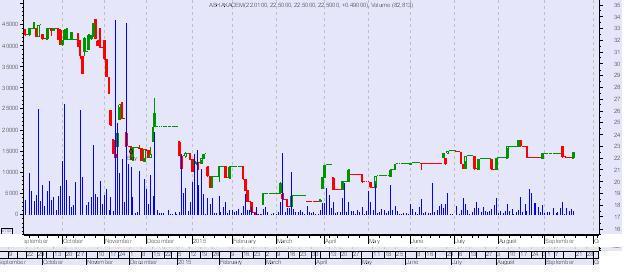
ASHAKACEM closed below the upper band by 13.9
per cent. Bollinger Bands are 76.53
per cent narrower than normal. The narrow width of the bands suggests low
volatility as compared to ASHAKACEM's normal range. Therefore, the probability of volatility
increasing with a sharp price move has increased for the near-term. During the past 10 bars, there have been one white candle
and two black candles for a net of one black candle. During the past 50 bars, there have been
seven white candles and seven black candles. Currently the MACD is bearish
since it is trading below its signal line. The MACD crossed below its signal
line 21 period(s) ago. Since the MACD crossed its moving average, ASHAKACEM's
price has increased 2.27
per cent, and has ranged from a high of N22.50
to a low of N22.00. The current value of the RSI is 57.87.
Analysis Opinion:
Traders should confirm this trend and position accordingly
for the very short term.
FBNH

FBNH closed below the upper band by 41.3 per
cent, Bollinger Bands are 3.36
per cent narrower than normal. The
current width of the bands (alone) does not suggest anything conclusive about
the future volatility or movement of prices. During
the past 10 bars, there have been four white candles and 5 black candles for a
net of one black candle. During the past
50 bars, there have been 13 white candles and 33 black candles for a net of 20
black candles. Currently the MACD is bullish since it is
trading above its signal line. The MACD crossed above its signal line 14
period(s) ago. Since the MACD crossed
its moving average, FBNH's price has increased 3.09 per cent, and has ranged from a high of N7.00 to a low of N5.95.
The current value of the RSI is 48.10
Analyst Opinion:
Traders and Investors should keep their gaze on
this stock and position now at the current low price.
SKYE BANK

SKYEBANK closed above the lower band by 45.7 per
cent. Bollinger Bands are 46.22
per cent wider than normal. The large width of the bands suggest high
volatility as compared to SKYEBANK's normal range. Therefore, the probability
of volatility decreasing and prices entering (or remaining in) a trading range
has increased for the near-term. During the past 10 bars, there have been four white candles
and five black candles for a net of one black candle. During the past 50 bars,
there have been 16 white candles and 30 black candles for a net of 14 black
candles. Currently the MACD is bearish
since it is trading below its signal line. The MACD crossed below its signal
line five period(s) ago. Since the MACD crossed its moving average, SKYEBANK's
price has increased 0.89
per cent, and has ranged from a high of N2.35 to a low of N2.20. The current value of the RSI is 50.95.
Analyst Opinion:
Long term investors should position at this low
price and traders should target reversal before buying.
STERLING BANK

STERLNBANK closed above the lower band by 24.7
per cent. Bollinger bands are 46.53
per cent narrower than normal. The narrow width of the bands suggests low
volatility as compared to STERLNBANK's normal range. Therefore, the probability
of volatility increasing with a sharp price move has increased for the
near-term. During the past 10 bars, there have been three
white candles and five black candles for a net of two black candles. During the
past 50 bars, there have been 12 white candles and 19 black candles for a net
of seven black candles. Currently the MACD is bearish since it is
trading below its signal line. The MACD crossed below its signal line 0
period(s) ago. Since the MACD crossed
its moving average, STERLNBANK's price has been unchanged, and has ranged from
a high of N2.13 to a low of N2.08. The current value of the RSI is 43.94.
Analyst Opinion:
The stock is trending down already, traders
should wait for reversal and jump in for sweet returns.


Comments
Post a Comment