NSE SECTORIAL TRADING RANGE CHARTS
The charts below are the 12
indexes of the NSE, representing sectors and other classes of indices for
effective reading and analysing of the market's performance. As you can see,
six of the 12 indices are trading above the 50 day moving average. NSE 50 is
closer to its 50-day but yet to cress over while 2 are trading below the 50 day
moving averages. Others are new indices that are trading above 7 and 20-day
moving average. The indices above 50DMA are NSE Banking, NSE Consumer Goods,
NSE Insurance, NSE 30, NSE ASEM and NSE OIL/Gas. NSE Industrial almost crossing the 50 day MA at the last
trading day of last week as revealed on the chart Goods and NSE LOTUSISLM were
below the 50-DMA. The more number of
indexes trading above 50 day moving average is an indication of up trending
market in the making.
NSE 50

NSE 30

NSEASEM

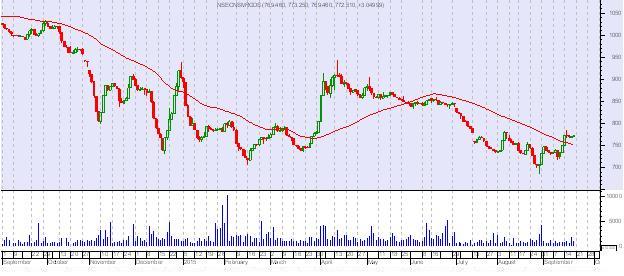
NSE BANKING

NSE CONSUMER GOODS
NSE INDUSTRIAL GOODS

NSE INSURANCE

NSE LOTUSISLM

NSE MAIN BOARD

NSE OIL/GAS

NSE PENSION

NSE PREMIUM

Note, the red
line on the chart is the 50-day moving average.


Comments
Post a Comment