TRADERS WATCH 12

The Nigerian Stock Exchange had a mixed performance as
mentioned in our outlook earlier to close the week in red as traders and
investors positioned in some low priced equities, while reacting to the CBN
suspension of nine commercial banks from the foreign exchange market, these
influenced trading activities for the period.
It is obvious that over regulation of the financial services
sector and the unclear monetary policy direction of an apex bank that is
becoming anti industrial cum economic growth as can be gauged by the liquidity level
and flow. These factors that determine the price direction of assets have
remained weak in the face of falling bond prices, rising inflation and interest
rates, as well as sliding stock and property prices, which are tell-tale signs
of an economy in recession.
Added to these are the inconsistent policies and unclear
economic policy direction of the government that have not helped matters with
many local and international investors still on the sideline. This is causing
harm to the system as can be measured by the declining industrial output.
Government should put the same energy and commitment used to beef up the
nation's security into revamping this economy to progressive change.
Meanwhile, the composite NSE All-Share Index shed 199.40
points to close at 27,450.91 points, from an opening figure of 27,650.32
points, representing a 0.72% decline on a low volume of transactions that
signifies possibility of markup in prices by smart money. Selling volume of
total trades for the week was 72%, while buying position was 28% to reverse the
previous week's bull sentiment.
NSEASI WEEKLY TIME FRAME

The
Composite index on a weekly time frame hasformed a double bottom with the yellow
line on the lower line of the long bullish channel that support break down or
reversal at this point. The index is slightly below its 20 and 50-Day moving
averages, the descending triangle chart pattern between the two red lines also
confirms thereversal or continuation of the ongoing trend. Traders should watch
out for first resistance level at 27,803.50, and any move down with first
support level at 27,179.66.
Looking at
technical indicator, the NSEASI closed above the
lower band by 49.2%, while MACD is bearish. RSI is reading 49.70, which is
neutral. Money flow index has reversed down, indicating that funds are exiting
the market. All momentum indicators are signaling sell, except the RSI.
UBA

UBA moved
1.8% lower over the past week on a mixed sentiment that the bank was among
those suspended from the forex market and later cleared and re-admitted by the
CBN, coupled with the release of its interim financials.
Traders
should watch for a break out of the symmetrical triangle chart pattern to continue
an uptrend to a strong resistance level of N4.95 or reverse down to touch first
support level at N4.02 each. UBA is trading below its 20-Day moving average at
N4.44 per share.
Looking at
the technical indicators, UBA closed below the
upper band by 42.5%. MACD is bearish, but just crossed below its signal line
last Friday. RSI is reading 55.20which
signifies strength. CCI is indicating buy,
just as MFI is indicating that funds are entering the stock as of Friday,
despite the 100% sell volume.
ACCESS BANK
Access Bank moved 2.44% lower over the past week and recently formed a
pennant chart pattern on its price action that indicates continuation of trend, as it breaks out of the bearish channel to support
uptrend. Traders should watch the uptrend to first resistance level of N6.10 or
a move down to support level of N5.06 per share. The stock is currently trading
above the 20 and 50-Day moving average on a daily chart, with 100% sell volume
as at Friday.
Looking at technical indicators, Access Bank closed below the upper
band by 36.4% and Bollinger Bands is 1.08% wider than
normal. MACD
is currently bullish since it is trading above its signal line. RSI is reading
58.36 and appears strong, some momentum indicators like CCI. MACD and RSI are
signaling sell, while SO is signalingbuy.
MFI is looking down on weekly and daily time-frame, showing that funds are
exiting the stock.
GTBANK

Guaranty
Trust Bank rose 4.12% higher over the past week on a positive sentiment in view
of its recent financials. Traders should watch the price action as it forms cup
and handle chart pattern to breakout the strong resistance level of N24.73 each
to N25.25, heading for the second resistance level of N29.74. But the candlestick formation at the top line of the bullish channel is signaling a pull back to
its first support level at N24.25.
Looking at the technical indicators, GTBank closed below
the upper band by 8.3% and Bollinger Bands are 60.10% wider than normal. The
large width of the bands suggests high volatility as compared to Guaranty's
normal range. The MACD remains bullish at overbought
range. Prices may continue to move higher for some time. Wait for pullback
before considering any long positions. RSI is reading 66.91 which appears to be
in overbought region. SO and CCI are signaling sell, while MACD and RSI are still saying buy. Money flow index is up and indicating
that fund is entering the stock with buying volume position of 85% and selling
position of 15%.
CAP
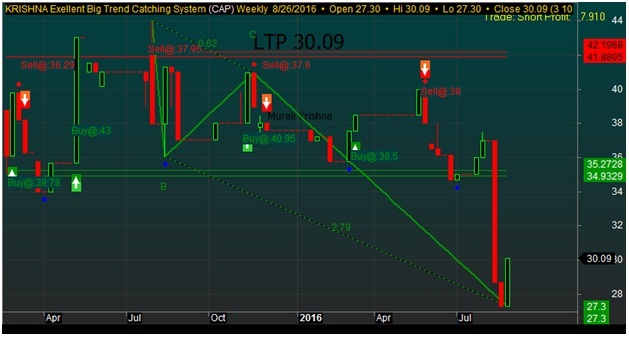
The share price of Chemical & Allied Products (CAP) rose 10.12 %
over the past week after suffering serious decline to hit a Four-year low of
N27.30 per share and side trended to form a double bottom that supported the
ongoing reversal trend. Traders should watch the uptrend to first resistance
level of N35.65 or a move down to support level of N27.30.
Looking at technical indicators, CAP closed above the lower
band by 7.4%. Bollinger Bands are 6.93% wider than normal. The current
width of the bands does not suggest anything conclusive about the future
volatility or movement of its price. MACD is bearish
at oversold range. Price has retraced up to move higher for some time.
RSI is reading 33.34 and appears to be over sold, while other momentum
indicators like CCI and RSI have signaled buy.
With SO and MACD signaling sell.
MFI is looking up, to indicate that funds are returning to the stock with
buying volume position of 100% as at market close on trading on Friday.
PRESCO

Presco moved up 9.555% over the past week, as it continues to side
range and spike up to form a bullish channel. Traders should watch the uptrend
to first resistance level of N46.21or a move down to support level of N35.64
each.
Looking at technical indicators, Presco closed above the
upper band by 16.2%. This, combined with
the steep uptrend, suggests that the upward trend in prices has a good chance
of continuing. However, a short-term
pull-back inside the bands is likely. Bollinger Bands are 41.68% narrower
than normal. MACD is in a bullish range. Price has retraced
up to move higher for some time. RSI is reading 71.24 and appears to be
overbought, while other momentum indicators like CCI, SO and RSI have signaled sell. With MACD signaling buy. MFI is looking down, to indicate
that funds are leaving the stock with
buying volume position of 100% for the week.
FCMB

FCMB fell by
14.96 percent over the past week, following the mixed sentiments toward the
bank's suspension from the FX market by the CBN despite the impressive
financialsposted for Q2, as the stock trended sideways within a bullish
channel. Traders should watch for a REVERSAL from the current trend to first
strong resistance at N1.27 each, any move down should touch first support level
at N0.97. FCMB is trading below its
20-Day moving average at N1.08 per share.
Looking at the technical indicators, FCMB closed above
the lower band by 23.0%. Bollinger Bands are 32.68% narrower than normal. MACD is bearish as it trades below its signal line. RSI is
reading 38.9 which appears to be neutral. Stochastic Oscillator, MACD and CCI
are saying sell, while RSI is still signaling buy.
MFI is indicating that funds are exiting the stock with 100% sell volume as at
last week Friday.
All Rights Reserved © Investdata Nig Ltd 2016
Ambrose Omordion
+2348032055467
+2348032055467


Comments
Post a Comment